
Your CFO just asked for proof that last quarter’s team retreat was worth the $47,000 investment. You know the team bonded. You saw people laughing together. But when it comes to hard numbers, you’re drawing a blank.
This is the challenge facing every People Ops leader at distributed companies. Team retreats feel valuable, but measuring that value in business terms can feel impossible.
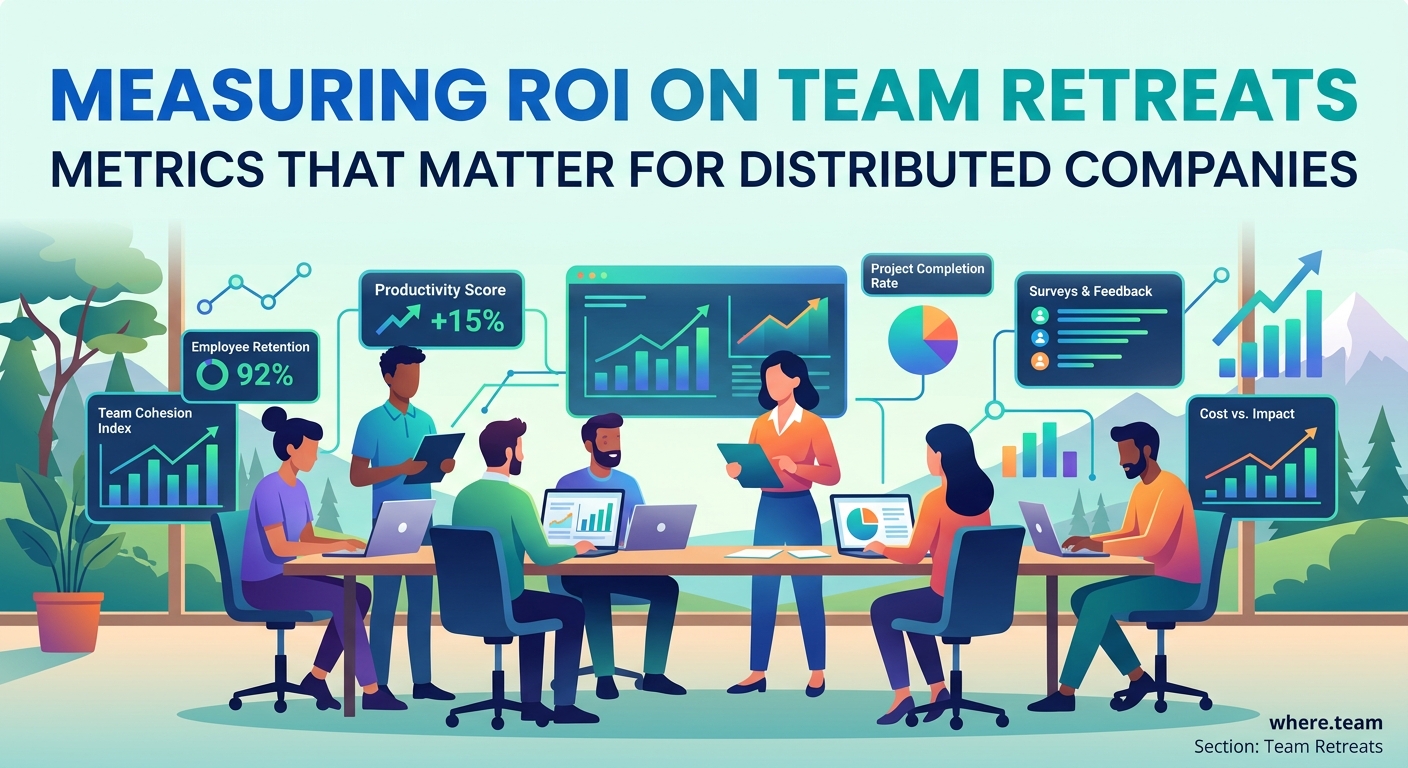
Measuring ROI on team retreats requires tracking both quantitative metrics like retention rates, productivity scores, and collaboration frequency alongside qualitative indicators such as relationship strength and cultural alignment. The most effective approach combines pre-retreat baseline data with post-retreat measurements across 30, 60, and 90-day intervals, creating a comprehensive picture that justifies investment to leadership while improving future retreat planning.
Why traditional ROI formulas fail for team retreats
Most ROI calculations follow a simple formula: (Gain from Investment – Cost of Investment) / Cost of Investment.
This works great for software purchases or marketing campaigns. It falls apart for team retreats.
The gains from bringing distributed teams together aren’t linear. They compound over time. A conversation at dinner might spark a collaboration six months later. A shared experience might prevent a key employee from leaving next year.
Traditional ROI formulas also ignore negative costs. What’s the price of NOT having retreats? Distributed teams without regular in-person time experience higher turnover, slower onboarding, and weaker collaboration.
The solution isn’t to abandon ROI measurement. It’s to expand what we measure and how we track it.
Setting up your measurement framework before the retreat
The biggest mistake People Ops leaders make is trying to measure ROI after the retreat ends. By then, you’ve lost your baseline data.
Start measuring at least 30 days before your team gathers. Here’s what to track:
-
Current collaboration patterns: Use your project management tools to document how often cross-functional teams work together. Track the frequency of spontaneous collaboration versus scheduled meetings.
-
Relationship strength scores: Survey your team about their working relationships. Ask people to rate how well they know colleagues in other departments on a scale of 1 to 10.
-
Productivity baselines: Capture current sprint velocity, project completion rates, or whatever productivity metrics matter for your team. Make sure you’re measuring output, not just activity.
-
Engagement and satisfaction levels: Run a pulse survey measuring team engagement, job satisfaction, and sense of belonging. These become your control group numbers.
-
Communication quality metrics: Track response times in Slack, average meeting lengths, and the ratio of synchronous to asynchronous communication. Why your remote meetings feel exhausting often comes down to relying too heavily on real-time communication.
Document everything in a shared spreadsheet. You’ll compare these numbers to post-retreat data at 30, 60, and 90-day intervals.
Quantitative metrics that actually matter
Numbers make executives happy. Here are the metrics that translate retreat value into language leadership understands.
Retention and recruitment impact
Calculate your annualized turnover rate in the 90 days before and after each retreat. Even a 2% improvement in retention creates massive savings.
Here’s the math: If your average employee costs $100,000 in salary and benefits, and replacing them costs 150% of their annual salary, each prevented departure saves $150,000. A retreat costing $50,000 that prevents even one departure pays for itself three times over.
Track these specific data points:
- Voluntary turnover rate (pre and post-retreat)
- Time to fill open positions
- Offer acceptance rates
- Employee referral rates
- Glassdoor or similar review scores
Productivity and output measurements
Measuring productivity for knowledge workers is tricky, but not impossible. Focus on outcomes, not hours worked.
Track sprint velocity if you use agile methodologies. Measure project completion rates. Count the number of cross-functional initiatives launched. Monitor customer satisfaction scores if your team impacts customers directly.
One distributed company we studied saw their average project completion time drop from 47 days to 31 days in the quarter following their first annual retreat. That 34% improvement came from better communication and stronger working relationships.
Collaboration frequency changes
Pull data from your communication and project tools. Look for:
- New cross-departmental projects initiated
- Increase in peer-to-peer recognition
- Growth in informal communication channels
- Reduction in duplicate work across teams
- Faster decision-making cycles
The goal isn’t more collaboration. It’s better collaboration. Sometimes you’ll see meeting frequency drop while project velocity increases. That’s a win.
Qualitative indicators you can’t ignore
Not everything that matters can be counted. But you can still measure it systematically.
“The best predictor of team performance isn’t IQ or individual talent. It’s psychological safety and relationship quality. Those factors are nearly impossible to build over Zoom alone.” – Dr. Amy Edmondson, Harvard Business School
Relationship network analysis
Before and after your retreat, ask team members to identify:
- Who they turn to for help with complex problems
- Who they’d grab coffee with if they could
- Who they trust to give honest feedback
- Who they’d recommend for a promotion
Map these responses to visualize your team’s relationship network. Strong, distributed teams show dense connection patterns. Weak teams cluster into silos.
After effective retreats, you’ll see new connections forming across departments and seniority levels. Building trust in hybrid teams when half your staff works remotely becomes much easier when people have shared in-person experiences to reference.
Cultural alignment surveys
Culture isn’t fluffy. It’s the operating system your team runs on.
Survey your team about:
- How well they understand company values
- Whether they see those values reflected in daily decisions
- How connected they feel to the company mission
- Whether they’d recommend the company to friends
Track these scores quarterly. Retreats should move the needle on all four metrics.
Innovation and creative output
Count new ideas proposed, experiments run, and creative risks taken. Track how many retreat conversations turn into actual initiatives.
One product team started a “retreat ideas” tag in their project tracker. Six months after their gathering, 23% of shipped features originated from retreat brainstorming sessions. That’s a measurable creative ROI.
Building your retreat ROI dashboard
Raw data doesn’t tell stories. You need to organize metrics into a format that communicates value clearly.
Create a simple dashboard tracking these categories:
| Metric Category | What to Track | Measurement Frequency |
|---|---|---|
| Financial Impact | Turnover costs avoided, recruitment savings, productivity gains | Quarterly |
| Collaboration Quality | Cross-team projects, communication patterns, decision speed | Monthly |
| Relationship Strength | Network density, trust scores, informal connections | Pre/post retreat |
| Cultural Alignment | Values understanding, mission connection, engagement scores | Quarterly |
| Innovation Output | New initiatives, creative experiments, implemented ideas | Ongoing |
| Employee Satisfaction | NPS scores, retention intent, referral rates | Quarterly |
Update your dashboard monthly. Share it with leadership quarterly. The goal is creating a clear narrative about how in-person time drives business outcomes.
Common measurement mistakes to avoid
Even experienced People Ops teams make these errors:
Measuring too soon: Don’t judge retreat success based on week-one feedback. The real impact unfolds over months. That post-retreat survey asking “how was it?” captures event satisfaction, not business value.
Tracking vanity metrics: Instagram photos and happy faces don’t prove ROI. Neither do attendance numbers or activity completion rates. Focus on outcomes that matter to your business.
Ignoring the counterfactual: What would have happened without the retreat? You need control data. Compare retreat quarters to non-retreat quarters. Look at teams that attended versus teams that didn’t.
Forgetting cost allocation: Include all costs in your calculations. Venue, travel, lost productivity, planning time, and opportunity costs. Undercounting costs makes your ROI look artificially high and damages credibility.
Expecting perfect attribution: You’ll never prove that specific business outcome X resulted purely from retreat Y. That’s okay. Look for correlation and directional improvement, not perfect causation.
Making your data tell a compelling story
Numbers alone won’t convince skeptical executives. You need narrative.
Structure your ROI reports like this:
- The investment: Total retreat costs broken down by category
- The baseline: Where key metrics stood before the retreat
- The changes: How those metrics moved in the following 90 days
- The business impact: What those changes mean in dollars and strategic value
- The stories: 2-3 specific examples of retreat-driven outcomes
- The recommendation: Whether to continue, adjust, or expand retreat investment
Include direct quotes from team members. Share specific examples of projects that emerged from retreat conversations. Quantify the value of retained employees who cite the retreat as a reason they stayed.
One People Ops leader presented retreat ROI this way: “Our $52,000 retreat prevented an estimated $450,000 in turnover costs, accelerated three strategic initiatives worth $1.2M in projected revenue, and increased team productivity by 18% based on sprint velocity. Here are the five employees who told exit interviewers that our retreat culture was why they turned down competing offers.”
That’s a story executives remember.
Improving measurement over time
Your first retreat ROI report will be imperfect. That’s expected.
Each retreat cycle, refine your approach:
- Add metrics that proved predictive
- Remove metrics that didn’t correlate with business outcomes
- Improve your baseline data collection
- Tighten the connection between activities and outcomes
- Build better comparison groups
After three or four retreats, you’ll have enough data to spot patterns. Maybe activities that actually build trust in remote teams consistently drive higher retention. Maybe certain venue types correlate with better collaboration outcomes.
Use this data to optimize future retreats. ROI measurement isn’t just about justification. It’s about continuous improvement.
Benchmarking against industry standards
Knowing your numbers is helpful. Knowing how they compare to similar companies is powerful.
Research from remote work consultancies suggests:
- Well-executed retreats typically reduce turnover by 15-25% in the following year
- Productivity improvements of 10-20% are common in the 90 days post-retreat
- Employee engagement scores usually increase 8-15 points on a 100-point scale
- Time to productivity for new hires decreases by 20-30% when they attend an early retreat
Your results will vary based on team size, retreat frequency, and execution quality. But these benchmarks help you assess whether your retreats are performing as expected.
If your metrics fall short of these ranges, look at how to plan your first company retreat without breaking the budget for ideas on improving effectiveness without increasing costs.
Presenting ROI to different stakeholders
Your CEO cares about different metrics than your team leads. Customize your ROI story for each audience.
For the CFO: Lead with financial metrics. Turnover costs avoided, productivity gains, and recruitment savings. Show the math clearly. Include conservative estimates and worst-case scenarios to build credibility.
For the CEO: Focus on strategic outcomes. How did the retreat advance company goals? What initiatives launched? How did it strengthen culture during a growth phase?
For department heads: Highlight team-specific improvements. Show how their team’s collaboration patterns changed. Share feedback from their direct reports. Connect retreat outcomes to departmental OKRs.
For team members: Emphasize the human impact. Better relationships, reduced isolation, stronger sense of belonging. Share aggregated feedback showing what the team valued most.
Different audiences need different data, but the underlying story stays consistent: in-person time drives measurable business value for distributed teams.
When the numbers don’t look good
Sometimes retreats don’t deliver expected ROI. That’s valuable information too.
If your metrics disappoint, resist the urge to hide the data or spin the story. Instead, investigate:
- Was the retreat poorly timed? (During a crisis or right before major deadlines)
- Did activities miss the mark? (Too much fun, not enough work, or vice versa)
- Were the wrong people included or excluded?
- Did choosing a team retreat venue create friction instead of connection?
- Was follow-through lacking after the event?
Poor ROI often stems from execution issues, not from the retreat concept itself. Use disappointing data to improve your next gathering.
One company saw zero productivity improvement after their first retreat. They discovered the problem: they’d scheduled pure social activities with no strategic work sessions. Their second retreat balanced connection and collaboration. Productivity jumped 22% in the following quarter.
Connecting retreat ROI to long-term strategy
The most sophisticated People Ops teams link retreat measurement to multi-year talent strategy.
Think about whether your distributed team should meet quarterly or annually. Your ROI data should inform that decision.
If you see strong 30-day impacts that fade by day 90, more frequent retreats might deliver better cumulative value. If impacts strengthen over time, annual gatherings with strong follow-through might be optimal.
Track how retreat ROI correlates with:
- Company growth phases
- Team size changes
- Market conditions
- Competitive talent pressures
- Strategic initiative success rates
This longitudinal data helps you optimize retreat frequency, budget, and format based on business conditions rather than arbitrary schedules.
The metrics that matter most
After measuring dozens of data points, which ones actually predict retreat success?
Based on patterns across distributed companies, these five metrics carry the most weight:
- Voluntary turnover rate change: The single best indicator of retreat value
- Cross-functional project velocity: Shows whether collaboration actually improved
- Employee Net Promoter Score: Captures overall satisfaction and retention intent
- Time to productivity for new hires: Reflects cultural strength and onboarding quality
- Strategic initiative completion rate: Connects retreats to business outcomes
If you can only track five metrics, track these. They correlate most strongly with both employee satisfaction and business performance.
Your ROI measurement action plan
Here’s your step-by-step process for measuring retreat ROI:
- Establish baseline metrics 30 days before your retreat across all key categories
- Document all retreat costs including hidden expenses and opportunity costs
- Run your retreat with clear objectives tied to measurable outcomes
- Survey participants within 48 hours for immediate feedback and commitment tracking
- Measure the same metrics at 30, 60, and 90 days post-retreat
- Calculate financial impact using conservative estimates for turnover prevention and productivity gains
- Gather qualitative stories and specific examples of retreat-driven outcomes
- Create a visual dashboard showing metric changes over time
- Present findings to leadership with clear recommendations for future retreats
- Document lessons learned and refine your measurement approach for next time
This process takes work. But it transforms retreats from “nice to have” team building into “essential” strategic investments.
Making the investment case stick
The best ROI measurement happens continuously, not just around retreat time.
Build retreat value into your regular reporting cadence. Include relevant metrics in quarterly business reviews. Share success stories in company all-hands meetings. Make the connection between in-person time and business outcomes part of your company’s operating narrative.
When retreat ROI becomes part of how your company thinks about distributed work, you’ll spend less time justifying budgets and more time optimizing experiences.
The data will speak for itself. Your job is making sure leadership hears it clearly.